Building a Machine Learning Model to Predict Survey Respondents’ Party Preference (75% Accuracy)
All data used in this project came from the political consulting firm Aristotle.
Using Supervised Learning to Predict Party Preference
Knowing an individual’s party preference is valuable information for a political data consulting firm. A Republican candidate’s primary election campaign wouldn’t want to waste money serving ads to Democrats, and a Democratic candidate’s general election campaign focused on getting the vote out doesn’t want their volunteers knocking on Republicans’ doors. Aristotle has already constructed numerous features in their dataset that classify individuals into various political profiles, for example, someone likely to watch liberal news channels or to support border security measures. However, 31% of individuals in Aristotle’s database lack any party registration or likely party preference. A feature that represents a machine learning model’s prediction of party preference for all rows could be a valuable addition to their dataset.
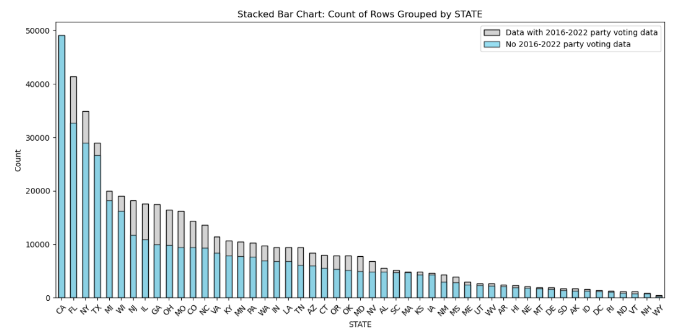
We decided that our target variable for the party preference modeling task would include only the data that should be most predictive of whether an individual would prefer a Democratic or Republican candidate: actual voter data indicating whether individuals voted in Democrat or Republican primaries from 2016 to 2022, with the most recent election we have data for taking precedent. This target variable is observed in 112,283 rows from the original 500,000 row dataset. The resulting dataset containing our target variable is fairly balanced between the different states, representing a wide sample of American voters (the gray areas of the chart below), with the exception of California which doesn’t provide election data on voters.
We pursued two strategies for modeling party preference: 1) exclude all Aristotle features built with voter data that we used to create our target feature, relying on less predictive demographic, census, donation, and consumer data to avoid any data leakage issues, and 2) include the more predictive Aristotle-engineered features that may contain data from our target variable with the aim of finding an optimal feature-weighting system for predicting party preference, and use the survey data set as a validation set to see if the data leakage affects the models’ performance on unseen, real-world data. .
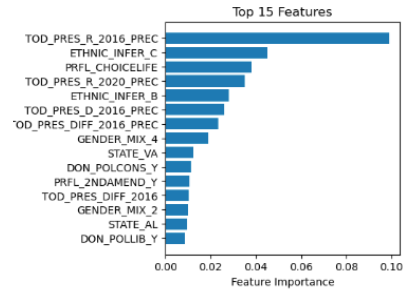
First, we identified 17 features that could include data from our target feature and removed them. Next, we set up our preprocessing pipeline, including one-hot encoding for categorical variables and mean imputation for missing values from numerical columns, and implemented scaling using StandardScaler for use in Logistic Regression and Support Vector Machine (SVM) models. In addition to Logistic Regression and SVM, we also experimented with three different tree-based models: XGBoost, GBM, and Random Forest. Our models achieved accuracy scores of 77%, 76%, 75%, 76%, and 51% respectively. The top feature that the XGBoost model used to split a data point (voter) on in its decision tree to decide whether to classify the voter as “Democrat” or “Republican” was “TOD_PRES_R_2016_PREC,” which gives the share of the vote from the voter’s precinct that went to the Republican candidate in 2016 (Trump). The next most likely split is a code for the voter likely being white, followed by the precinct vote share to Trump in the 2020 election, and a code for the voter likely being black. See the rest of the top 15 features of the XGBoost model below.
We then used the trained models to predict the party for 1,560 individuals from the dataset who had an additional feature: responses to a survey in Setpember 2023 asking who they planned to support for President in 2024. None of the 1,560 rows with survey responses were included in the models’ training or test sets. To compare our models’ predicted party for each survey respondent with their actual survey responses, we coded as Democrats survey respondents who indicated support for the two Democratic candidates (President Biden and Marianne Williamson), and coded as Republican respondents who indicated support for any of the candidates running in the Republican primary. Respondents who indicated support for Robert Kennedy Jr. (Independent) and Undecided were dropped from the dataset. Our best model, XGBoost, achieved 67% accuracy at predicting the actual party preferences of the 2024 presidential candidate survey respondents.
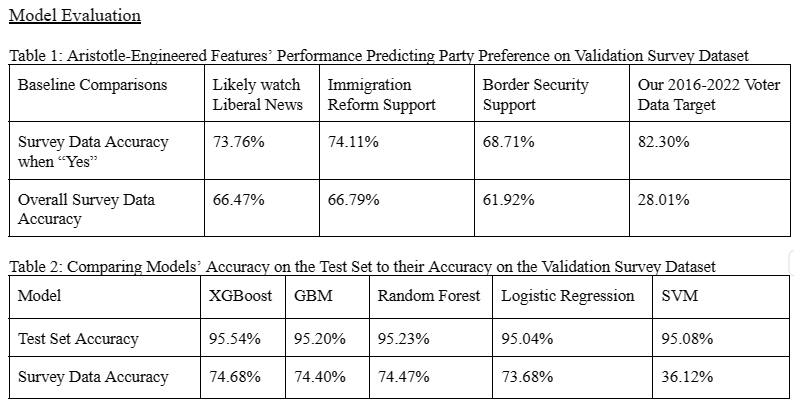
We next attempted the second proposed approach to model party preference: include the more predictive Aristotle-engineered features for modeling that may introduce target data leakage. For example, the “PRFL_LIBERAL_NEWS” feature, according to Aristotle’s records, is coded as ‘Yes’ if an individual has a liberal or moderate political ideology code, a registered Democrat code, or has voted in a Democratic primary (which would include data from our target variable), or is a Clinton, Biden, Obama or Sanders supporter. On the survey dataset, 73% of individuals who are coded as “Yes” for PRFL_LIBERAL_NEWS indicated they support a Democratic candidate for president in the survey demonstrating that it is a highly predictive feature.
Model Evaluation
After including these 17 features back in our dataset, we used the same five machine learning algorithms to train our models. For this second modeling strategy the only evaluation metric that mattered was the models’ accuracy at predicting the candidate preference responses in the validation survey dataset since the test set accuracy metric was artificially inflated by data leakage between our target feature and predictor features.
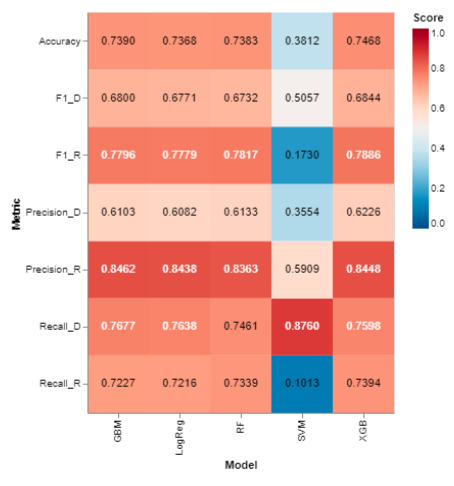
The heatmap below shows F1, Precision, and Recall scores by target variable and model on the validation survey dataset. Looking at the “Accuracy” row, you can see that our most accurate model at predicting party preference on the validation survey dataset was XGBoost at 74.68%. Overall the model does much better at predicting Republicans with an F1 score of 79% vs 68% for Democrats. The precision score of 62.26% for Democrats shows that the model is showing a bias at over predicting the Democrat class with relatively more false positives, which is also reflected in the failure analysis carried out below. The other two tree-based models and the Logistic Regression model all achieved accuracy scores within a percentage point of the XGBoost model, whereas the SVM model likely suffered from the target data leakage issue with a survey validation dataset accuracy score of 38% despite achieving a test set score of 95%.
The bar chart below shows the top 10 features of each of the three decision tree-based models. All 3 models’ top 10 features are one-hot encoded categorical values, and 10 of those 15 different features are from engineered Aristotle features (those with the “PRFL_” prefix). Other features include a feature indicating whether an individual has donated to a Democratic campaign and demographic and census data features identifying Christian families, hispanic individuals, and whether an individual resides in an urban or rural county.
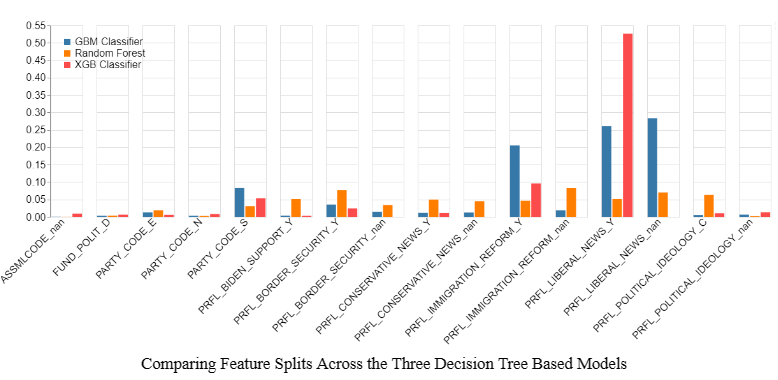
All of the tree-based models improve upon the Aristotle-engineered features PRFL_LIBERAL_NEWS and PRFL_IMMIGRATION_REFORM’s baselines of 66% and 67% accuracy on the survey validation set by 6-9%. The differences in their “Feature Importance” scores in Figure 6 are more indicative of the different splitting strategies of the tree-based algorithms than relative feature importance in their models. XGBoost’s very high feature importance of “Liberal News’’ doesn’t mean that the model is finding it far more predictive than the rest of the features, rather that it is frequently splitting on that feature depending on whether it’s encoded as “Yes” or “NaN, creating two distinct paths before splitting on another feature and continuing this process of splitting down different paths to reach a prediction until the algorithm reaches its “max depth” hyperparameter (in our case the default of 7 splits). For example, the XGBoost model splits on PRFL_LIBERAL_NEWS == “Yes” 52% of the time. However, when we remove LIBERAL_NEWS as a feature, the XGBoost model simply replaces it with PRFL_IMMIGRATION_REFORM, splitting on it 56% of the time with accuracy on the test and survey validation sets decreasing just .05% and 1.14% respectively.
In contrast to the tree-based and logistic regression models, the target data leakage issue clearly corrupted the SVM model. While the SVM achieves similar performance to the other models on the test set at 94% accuracy, it performs even worse on the validation survey data set than a coin flip. While tree based models inherently capture non-linear relationships and interactions between features, SVM works by finding linear decision boundaries for classification among all the individual data points. The SVM likely draws a decision boundary utilizing this leakage that then fails to generalize to unseen data.
It appears that the decision trees allow us to leverage data interactions and a manageable amount of target data leakage from our target variable to capture underlying patterns that can then generalize well on unseen data, such as the validation survey data set.
Failure Analysis
Overall, our final XGBoost model demonstrates bias in the survey data set towards predicting for Democrats, where compared with the actual party preferences of survey responses there are 22% more predicted Democrat responses than actual Democrat responses, and 12% fewer predicted Republican responses than actual Republican responses. A potential contributing factor to the model’s bias towards over-predicting for Democrats among the survey respondents could be that the survey respondents do not appear to be very representative of either the typical voter or the 500,000 sample voter dataset that the model was trained on, skewing much older and more Republican, as can be seen in the charts below:
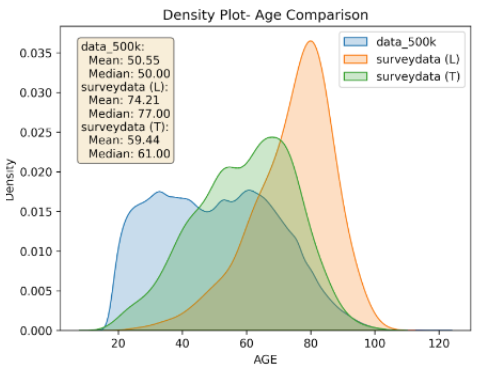
Note: The survey respondents are broken up in the chart above between those who responded via text (“surveydata (T)” in green) and via landline phone (“surveydata (L)” in orange)
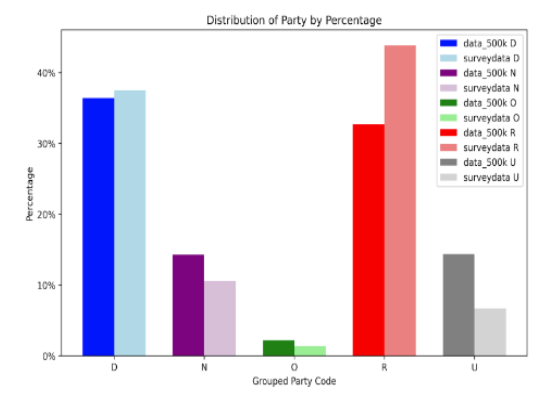
Note: D = Democrat, N = Non-Partisan, O = Other Party, R = Republican, and U = Unknown
While the model The 75% accuracy of the XGBoost model on the survey data validation set can be further analyzed by breaking the accuracy score into two groups: 547 survey respondents that have the 2016-22 voter data used for our target variable, and 986 survey respondents that don’t. Our model accurately predicts the former’s party preference at 83%, and the latter’s at 70%.
The failure analysis shows that 16.4% of the survey respondents who have voter data from our target variable present indicated support for a presidential candidate whose party is the opposite of the last party the individual supported on record. That discrepancy explains most of the 17% error rate when predicting for this group. In 79 instances (14%), the model correctly predicted the party corresponding to an individual’s voting history, yet the individual indicated in the survey that they planned on voting for a candidate of the opposite party. When voter data is available, the model almost always decides to classify the individual as the same party that their voter data indicates.
While “Liberal News” does a very good job of predicting party preference when voter data is available, it struggles as a predictor for the 986 voters that don’t have 2016-22 voter data available. It’s likely not the only feature that contributes to the overclassification of Democratic voters, but it appears to be a big contributor, where voters with Republican candidate preferences are misclassified as Democrats 42% of the time when PRFL_LIBERAL_NEWS is encoded as “Yes.” At the same time, removing PRFL_LIBERAL_NEWS as a feature in model training only weakens the model’s performance both on the test set and on generalizing on the survey data. It would not be surprising that some peoples’ politics has shifted since the feature was initially created, or that the majority of that shift would be from Democrat to Republican in the survey dataset when it so heavily skews older and more Republican, which could contribute to the overclassification of Democrats by the model. Regardless of the reason, a likely profitable area of future work for Aristotle to pursue would involve evaluating and adjusting previously engineered features such as “Liberal News,” which would help to further improve the performance of the new machine learning party preference feature created by our XGBoost model.
Discussion
We learned with our supervised party preference modeling task that we could accurately predict the party of the preferred presidential candidate of survey respondents 75% of the time with our XGBoost model trained on 217 features, a significant improvement of 9% over the accuracy of the most predictive Aristotle-engineered feature. While the model performed significantly worse predicting party preference for the 224 individuals from the survey data set coded by Aristotle as “Non-Partisans” and “Unknowns” for party preference, an accuracy of 59% is still significantly better than a coin flip and provides Aristotle with a good starting point for attempting to predict party preference among that particularly challenging class of voters. A surprise finding was that 18% of our respondents with voter data from 2016-2022 indicated support for the opposite party of their most recent voter data on file. This suggests that there may be a significant error rate in the survey responses pulling our accuracy scores downwards since it seems unlikely that nearly a fifth of voters have switched their party allegiance in the last few years.
Another surprising finding was how similar the supervised party preference models performed on both the test set and the survey validation set (with the exception of the SVM model, which likely was corrupted by data leakage from the target variable). We were hopeful that the tree-based models would overcome the data leakage issue since the target variable leakage isn’t an exact match with any of the predictor variables, but is used in their construction, allowing the decision tree-based models to effectively weight and sort through the different features to find predictive combinations of features. It was a complete surprise however that the logistic regression model was just one percent less accurate than the best tree-based model on the survey validation dataset, especially when considering there were 605 total predictor features after one-hot encoding was applied in preprocessing. The fact that four different machine learning algorithms correctly predicted survey respondents’ party preference between 73-75% shows that there is a very strong signal for party preference within the data.
Full Report
From a research paper I co-authored with peers in my Master’s of Applied Data Science at the University of Michigan. The full paper can be found here.